
.webp)


In the world of Revenue Operations (RevOps), data is king. And when it comes to maximizing revenue potential, HubSpot graphs are a game-changer. These powerful visualizations provide invaluable insights into your sales, marketing, and customer service efforts, empowering you to make data-driven decisions that drive revenue growth. Let's explore how you can leverage HubSpot graphs to improve your revenue.
Pipeline Performance: Visualizing Sales Opportunities
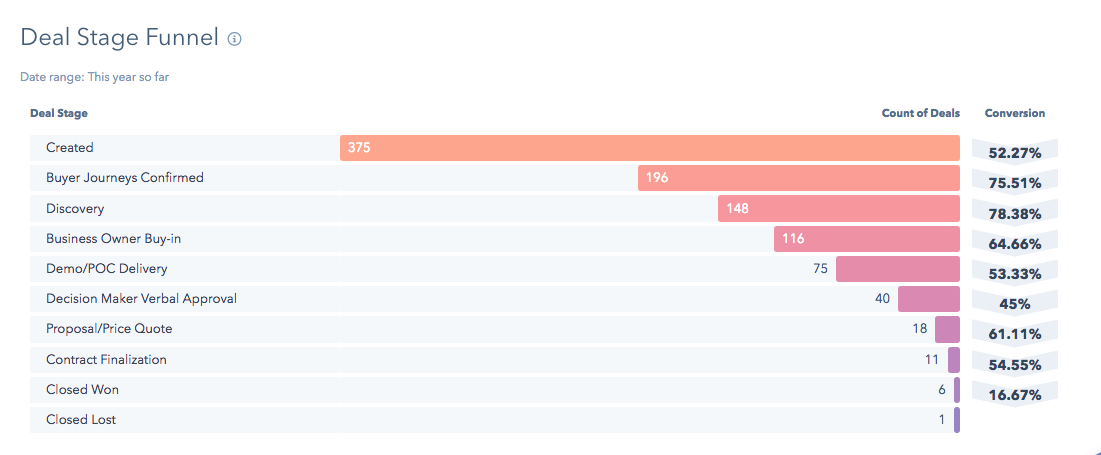
One of the key metrics in revenue generation is the health of your sales pipeline. With HubSpot's pipeline performance graphs, you can gain a clear understanding of the distribution and progression of your sales opportunities. These graphs allow you to track the number of deals in each stage of the pipeline, identify bottlenecks, and focus your efforts where they matter most.
For example, by analyzing the pipeline performance graph, you may discover that a significant number of deals are stuck in the negotiation stage. This insight prompts you to investigate further and take necessary actions, such as providing additional sales training or streamlining the negotiation process. By addressing these issues, you can accelerate deal closure and improve overall revenue performance.
Marketing Attribution: Tracking Campaign Impact
Marketing plays a crucial role in revenue generation, but it's often challenging to measure the direct impact of specific campaigns or channels. This is where HubSpot's marketing attribution graphs come into play. They provide a comprehensive view of how your marketing efforts contribute to revenue by attributing sales and conversions to specific marketing activities.
Imagine you ran a targeted email campaign to promote a new product. Using the marketing attribution graphs, you can track the revenue generated from the campaign, identify the most successful channels, and optimize your marketing strategy accordingly. By understanding which campaigns have the highest ROI, you can allocate resources more effectively, focusing on initiatives that yield the greatest revenue impact.

Customer Satisfaction: Monitoring Support Metrics
Happy customers are more likely to become loyal advocates and contribute to your revenue growth. HubSpot's customer satisfaction graphs enable you to monitor key support metrics, such as customer feedback, response time, and resolution rates. By visualizing these metrics, you can identify areas where customer satisfaction may be lacking and take proactive steps to improve the customer experience.
For instance, if you notice a sudden increase in customer complaints or a decline in satisfaction ratings, you can investigate the underlying causes. By analyzing the customer satisfaction graphs alongside other data, such as support ticket volume or response time, you can pinpoint specific issues, implement corrective actions, and enhance the overall customer journey. Improving customer satisfaction directly translates into increased retention, upsell opportunities, and ultimately, higher revenue.
Revenue Forecasting: Predicting Future Performance
Accurate revenue forecasting is vital for effective resource allocation, goal setting, and strategic decision-making. HubSpot's revenue forecasting graphs provide a visual representation of your predicted revenue based on historical data, trends, and future projections.
By analyzing revenue forecasting graphs, you can identify potential gaps between your targets and current performance. This enables you to make data-driven adjustments to your strategies, such as increasing marketing spend, reallocating sales resources, or refining pricing models. With the ability to anticipate revenue outcomes, you can stay ahead of the curve, make informed business decisions, and optimize your revenue potential.
Defining ICPs for the Sales team to narrow their focus & efforts
To enhance the efficiency of the Sales team, HubSpot graphs help in defining Ideal Customer Profiles (ICPs). This involves narrowing the team's focus and concentrating efforts on specific target customers. HubSpot graphs provide visual representations of key data points, enabling analysis and identification of patterns and characteristics of the most successful customers.
Study the HubSpot graphs to create clear and concise ICPs that outline the ideal customer traits and attributes. This will help prioritize prospecting efforts and tailor messaging and approaches to engage with the most promising leads, resulting in improved sales outcomes.
How GrowthSpree helped one of its clients
Problem: Some defined ICP questions for prospects were not being filled due to resistance from SDR and AE. They needed to open the CRM after the meeting to fill in the data points.
Solution: We implemented Luru, a software extension that integrates with meeting platforms like Zoom or Google Meet. This allows SDRs and AEs to update the required information during the call itself, eliminating the need to open the CRM and, making the questions more objective in nature for easier and quicker data collection.

Once the data was complete, we used HubSpot reports to narrow down the ICP further. This helped the Sales team to focus more on the narrowed ICP and avoid wasting time on irrelevant prospects and beating around the bush.
Conclusion
Incorporating RevOps principles into your business strategy is crucial for driving revenue growth. With HubSpot graphs as your visual analytics tool, you can unlock valuable insights, identify areas of improvement, and make data-driven decisions that directly impact your revenue.
Whether it's optimizing your sales pipeline, measuring marketing attribution, improving customer satisfaction, or forecasting future revenue, HubSpot graphs provide a comprehensive view of your revenue operations.
Need help in optimizing and building a seamless data-driven Sales Pipeline that streamlines with your Marketing team, thus bridging the RevOps gap? Contact us here.
Emphasize your product's unique features or benefits to differentiate it from competitors
In nec dictum adipiscing pharetra enim etiam scelerisque dolor purus ipsum egestas cursus vulputate arcu egestas ut eu sed mollis consectetur mattis pharetra curabitur et maecenas in mattis fames consectetur ipsum quis risus mauris aliquam ornare nisl purus at ipsum nulla accumsan consectetur vestibulum suspendisse aliquam condimentum scelerisque lacinia pellentesque vestibulum condimentum turpis ligula pharetra dictum sapien facilisis sapien at sagittis et cursus congue.
- Pharetra curabitur et maecenas in mattis fames consectetur ipsum quis risus.
- Justo urna nisi auctor consequat consectetur dolor lectus blandit.
- Eget egestas volutpat lacinia vestibulum vitae mattis hendrerit.
- Ornare elit odio tellus orci bibendum dictum id sem congue enim amet diam.
Incorporate statistics or specific numbers to highlight the effectiveness or popularity of your offering
Convallis pellentesque ullamcorper sapien sed tristique fermentum proin amet quam tincidunt feugiat vitae neque quisque odio ut pellentesque ac mauris eget lectus. Pretium arcu turpis lacus sapien sit at eu sapien duis magna nunc nibh nam non ut nibh ultrices ultrices elementum egestas enim nisl sed cursus pellentesque sit dignissim enim euismod sit et convallis sed pelis viverra quam at nisl sit pharetra enim nisl nec vestibulum posuere in volutpat sed blandit neque risus.

Use time-sensitive language to encourage immediate action, such as "Limited Time Offer
Feugiat vitae neque quisque odio ut pellentesque ac mauris eget lectus. Pretium arcu turpis lacus sapien sit at eu sapien duis magna nunc nibh nam non ut nibh ultrices ultrices elementum egestas enim nisl sed cursus pellentesque sit dignissim enim euismod sit et convallis sed pelis viverra quam at nisl sit pharetra enim nisl nec vestibulum posuere in volutpat sed blandit neque risus.
- Pharetra curabitur et maecenas in mattis fames consectetur ipsum quis risus.
- Justo urna nisi auctor consequat consectetur dolor lectus blandit.
- Eget egestas volutpat lacinia vestibulum vitae mattis hendrerit.
- Ornare elit odio tellus orci bibendum dictum id sem congue enim amet diam.
Address customer pain points directly by showing how your product solves their problems
Feugiat vitae neque quisque odio ut pellentesque ac mauris eget lectus. Pretium arcu turpis lacus sapien sit at eu sapien duis magna nunc nibh nam non ut nibh ultrices ultrices elementum egestas enim nisl sed cursus pellentesque sit dignissim enim euismod sit et convallis sed pelis viverra quam at nisl sit pharetra enim nisl nec vestibulum posuere in volutpat sed blandit neque risus.
Vel etiam vel amet aenean eget in habitasse nunc duis tellus sem turpis risus aliquam ac volutpat tellus eu faucibus ullamcorper.
Tailor titles to your ideal customer segment using phrases like "Designed for Busy Professionals
Sed pretium id nibh id sit felis vitae volutpat volutpat adipiscing at sodales neque lectus mi phasellus commodo at elit suspendisse ornare faucibus lectus purus viverra in nec aliquet commodo et sed sed nisi tempor mi pellentesque arcu viverra pretium duis enim vulputate dignissim etiam ultrices vitae neque urna proin nibh diam turpis augue lacus.

.webp)
.webp)


Related posts
.webp)
.webp)
.png)
